✨ October Update | FL Newsletter
miami dade

miami dade
Here’s the latest market insights and updates for you.
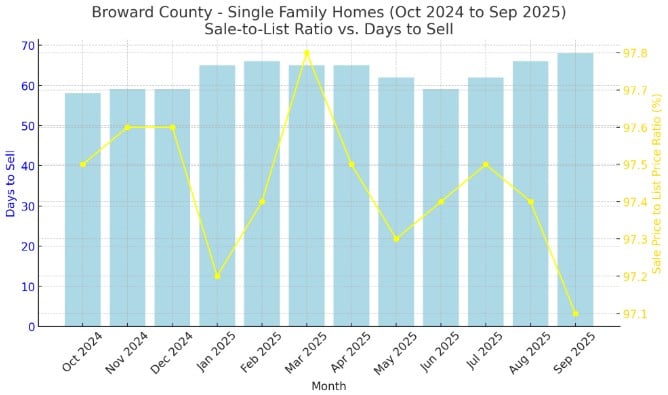
From October 2024 to September 2025, Broward County’s single-family home market demonstrated overall stability, with consistent pricing and moderate changes in selling time. The average sale-to-list price ratio, represented by the yellow line, remained steady between 97% and 98%, indicating that most homes sold just slightly below their asking prices. Meanwhile, the light blue bars show that the average days to sell fluctuated between 58 and 68 days, with the longest selling times recorded in early and late 2025. This gradual increase in days on market suggests a mild slowdown in buyer activity, even as home prices stayed relatively firm. Overall, the data reflects a balanced housing market—one where sellers maintained reasonable pricing power, and buyers took slightly longer to make purchasing decisions, resulting in stable market conditions throughout the year.
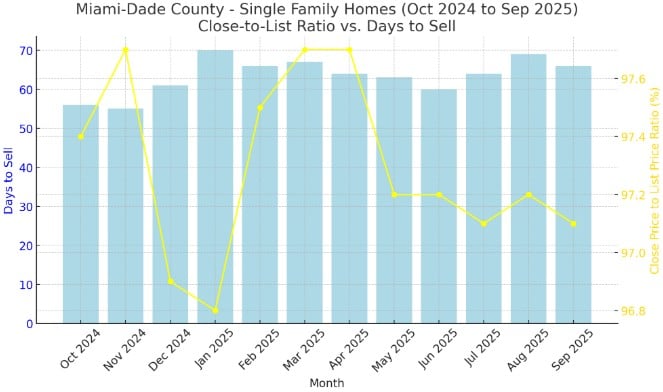
From October 2024 to September 2025, the single-family home market in Miami-Dade County showed signs of stability with minor seasonal fluctuations. The close-to-list price ratio, illustrated by the yellow line, remained consistent between 96.8% and 97.7%, suggesting that homes generally sold very close to their asking prices throughout the year. Meanwhile, the average days to sell, represented by the light blue bars, ranged from 55 to 70 days. The market saw the quickest sales in November 2024, while January 2025 marked the slowest period, possibly reflecting a typical seasonal cooling after the holidays. Despite slight increases in selling time during the first quarter of 2025, pricing stability indicates continued buyer demand and balanced market conditions. Overall, Miami-Dade’s single-family sector maintained a steady pace, showing resilience and healthy buyer-seller dynamics over the year.

Stay up to date on the latest real estate trends.

Discover the best fun activities for kids in Downtown Miami, including parks, museums, outdoor adventures, educational attractions, and family-friendly entertainment f… Read more

Discover the top restaurants in Coral Gables, Florida. Explore fine dining, international cuisine, local favorites, and culinary experiences that make Coral Gables one… Read more

Discover where to get the best brunch in Downtown Miami. Explore top brunch restaurants, waterfront dining, trendy cafés, and local favorites offering delicious food, … Read more

A Complete Homeowner’s Guide on Air Conditioners

Miami Beach

Downtown Miami
Discover the best neighborhoods in Downtown Miami for luxury living, waterfront views, dining, entertainment, and modern city life. Explore the top areas to live and v… Read more

Miami Beach

Top Taquerias in Miami Beach for Authentic Tacos, Mexican Cuisine, and Local Favorites

Downtown Miami
Best Grocery Stores and Markets in Downtown Miami for Fresh Food and Everyday Shopping
You’ve got questions and we can’t wait to answer them.